These Are America’s Safest Cities
Threats to safety in the U.S. range from health crises and natural disasters to financial challenges like unaffordable mortgages, lack of health insurance, and inflation.
While no place is risk-free, the level of danger we face often depends on where we live.
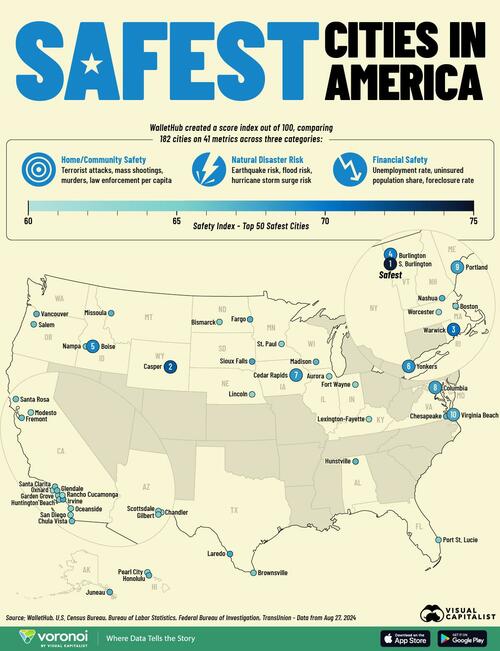
This map, via Visual Capitalist’s Kayla Zhu, visualizes the 50 safest cities in America according to WalletHub, which analyzed 182 cities across 41 key metrics to assess overall safety.
The three main categories of metrics analyzed are:
- Home and community safety: Law enforcement per capita, prevalence of terrorist attacks, mass shootings, murders,
- Natural disaster risk: Earthquake risk, flood risk, hurricane storm surge risk, wildfire risk
- Financial safety: Unemployment rate, uninsured population, foreclosure rate
The data is updated as of August 27, 2024 and was collected from the U.S. Census Bureau, Bureau of Labor Statistics, Federal Bureau of Investigation, TransUnion, and other sources.
Which Cities are the Safest in America?
Below, we show the 50 safest cities in America based on WalletHub’s analysis.
| Overall Rank | City | Overall safety score |
|---|---|---|
| 1 | South Burlington, VT | 74.2 |
| 2 | Casper, WY | 71.5 |
| 3 | Warwick, RI | 70.3 |
| 4 | Burlington, VT | 69.6 |
| 5 | Boise, ID | 69.2 |
| 6 | Yonkers, NY | 68.8 |
| 7 | Cedar Rapids, IA | 68.4 |
| 8 | Columbia, MD | 68.1 |
| 9 | Portland, ME | 67.8 |
| 10 | Virginia Beach, VA | 67.6 |
| 11 | Irvine, CA | 67.4 |
| 12 | Fargo, ND | 67.2 |
| 13 | Chesapeake, VA | 67.1 |
| 14 | Missoula, MT | 67.0 |
| 15 | Nashua, NH | 67.0 |
| 16 | Juneau, AK | 67.0 |
| 17 | Vancouver, WA | 66.9 |
| 18 | Honolulu, HI | 66.9 |
| 19 | Madison, WI | 66.8 |
| 20 | Huntsville, AL | 66.8 |
| 21 | Laredo, TX | 66.7 |
| 22 | Sioux Falls, SD | 66.7 |
| 23 | Chula Vista, CA | 66.3 |
| 24 | Fremont, CA | 66.2 |
| 25 | Glendale, CA | 66.2 |
| 26 | Salem, OR | 66.1 |
| 27 | Santa Rosa, CA | 65.9 |
| 28 | Nampa, ID | 65.9 |
| 29 | Santa Clarita, CA | 65.8 |
| 30 | Brownsville, TX | 65.5 |
| 31 | Gilbert, AZ | 65.3 |
| 32 | Port St. Lucie, FL | 65.2 |
| 33 | Boston, MA | 65.2 |
| 34 | St. Paul, MN | 65.0 |
| 35 | Garden Grove, CA | 64.8 |
| 36 | Huntington Beach, CA | 64.8 |
| 37 | Oceanside, CA | 64.8 |
| 38 | Bismarck, ND | 64.7 |
| 39 | Scottsdale, AZ | 64.3 |
| 40 | Pearl City, HI | 64.1 |
| 41 | Aurora, IL | 64.1 |
| 42 | Fort Wayne, IN | 64.0 |
| 43 | San Diego, CA | 64.0 |
| 44 | Modesto, CA | 63.7 |
| 45 | Worcester, MA | 63.5 |
| 46 | Chandler, AZ | 63.3 |
| 47 | Lincoln, NE | 63.3 |
| 48 | Rancho Cucamonga, CA | 63.1 |
| 49 | Oxnard, CA | 63.1 |
| 50 | Lexington-Fayette, KY | 62.7 |
Many of the top safest cities are concentrated in the Northeastern United States, including South Burlington, Burlington, Portland (Maine), Nashua, Warwick, and Yonkers.
This region generally has lower natural disaster risks compared to other areas, contributing to higher safety scores.
South Burlington, the second largest city in Vermont, ranked first overall as the safest city in America. It has one of the lowest pedestrian fatality rates in the nation and one of the highest number of EMTs and paramedics per capita, according to WalletHub.
The city also ranks highly for financial stability, boasting the lowest unemployment rate in the U.S. at 1.9%, the second-lowest share of seriously underwater mortgages, and the third-lowest rate of non-business bankruptcy filings per capita over the past year.
These indicators suggest that residents are financially secure, with a lower risk of facing unpaid bills, property loss, or homelessness.
To learn more about the environment of different U.S. cities, check out this graphic that visualizes the dirtiest cities in the U.S.
Tyler Durden
Thu, 11/21/2024 – 23:00
[H/T Zero Hedge]

