
Hawaii Has America's Highest Life Expectancy, West Virginia The Lowest
Life expectancy varies widely across the U.S., with clear regional patterns emerging in the latest data.
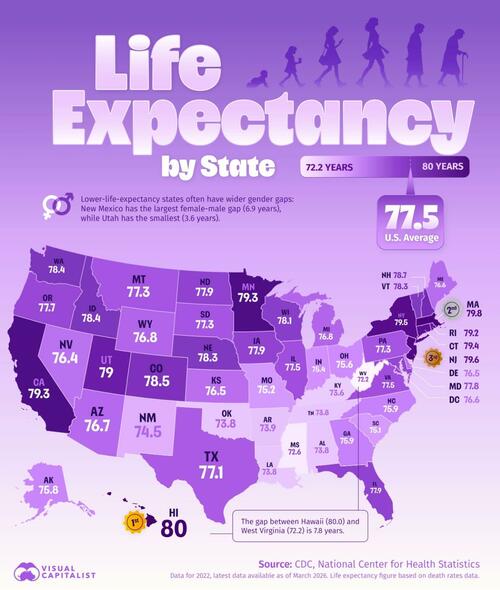
States in the Northeast and on the West Coast tend to have higher life expectancies, while many in the South and Appalachia rank lower.
This map, via Visual Capitalist's Niccolo Conte, shows these differences using data from the CDC’s National Center for Health Statistics, based on 2022 life tables published in December 2025, the latest publicly available state-level figures as of March 2026.
The CDC’s report uses period life tables, which estimate how long a hypothetical group would live if it experienced the death rates observed in 2022 at every age. In other words, the measure captures current mortality conditions in each state, not a forecast for babies born there today.
Where Americans Live the Longest, and the Shortest
Among the 50 states and D.C., Hawaii had the highest life expectancy at birth in 2022 at 80.0 years. Massachusetts followed at 79.8, with New Jersey, New York, and Connecticut close behind.
The data table below shows the life expectancy of every U.S. state and D.C.:
| Rank | State | Life Expectancy (Years) |
|---|---|---|
| 1 | Hawaii | 80.0 |
| 2 | Massachusetts | 79.8 |
| 3 | New Jersey | 79.6 |
| 4 | New York | 79.5 |
| 5 | Connecticut | 79.4 |
| 6 | California | 79.3 |
| 7 | Minnesota | 79.3 |
| 8 | Rhode Island | 79.2 |
| 9 | Utah | 79.0 |
| 10 | New Hampshire | 78.7 |
| 11 | Colorado | 78.5 |
| 12 | Idaho | 78.4 |
| 13 | Washington | 78.4 |
| 14 | Nebraska | 78.3 |
| 15 | Vermont | 78.3 |
| 16 | Wisconsin | 78.1 |
| 17 | North Dakota | 77.9 |
| 18 | Iowa | 77.9 |
| 19 | Florida | 77.9 |
| 20 | Maryland | 77.8 |
| 21 | Oregon | 77.7 |
| 22 | Illinois | 77.5 |
| 23 | Virginia | 77.5 |
| 24 | Pennsylvania | 77.3 |
| 25 | South Dakota | 77.3 |
| 26 | Montana | 77.3 |
| 27 | Texas | 77.1 |
| 28 | Wyoming | 76.8 |
| 29 | Michigan | 76.8 |
| 30 | Arizona | 76.7 |
| 31 | Maine | 76.6 |
| 32 | District of Columbia | 76.6 |
| 33 | Delaware | 76.5 |
| 34 | Kansas | 76.5 |
| 35 | Nevada | 76.4 |
| 36 | Georgia | 75.9 |
| 37 | North Carolina | 75.9 |
| 38 | Alaska | 75.8 |
| 39 | Ohio | 75.6 |
| 40 | Indiana | 75.4 |
| 41 | Missouri | 75.2 |
| 42 | South Carolina | 75.1 |
| 43 | New Mexico | 74.5 |
| 44 | Arkansas | 73.9 |
| 45 | Oklahoma | 73.8 |
| 46 | Tennessee | 73.8 |
| 47 | Alabama | 73.8 |
| 48 | Louisiana | 73.8 |
| 49 | Kentucky | 73.6 |
| 50 | Mississippi | 72.6 |
| 51 | West Virginia | 72.2 |
On the other end of the ranking, West Virginia came in last at 72.2 years, behind Mississippi at 72.6 and Kentucky at 73.6.
The broad pattern is regional: the Northeast and West Coast have higher life expectancies, while many Southern and Appalachian states cluster at the bottom.
Why the National Average Misses the State Divide
While the national average is 77.5 years, only 21 states cleared that mark. Illinois and Virginia matched it exactly, and the remaining 28 states came in below it.
The CDC also found that females had higher life expectancy than males in every state and D.C., but the size of that gender gap varied widely. States on the lower end of life expectancy tended to have larger divides, while higher-ranked states had smaller gaps.
For example, New Mexico (ninth-lowest life expectancy at 74.5) recorded the largest female-male gap at 6.9 years, while Utah (ninth-highest at 79 years) had the smallest at 3.6 years.
If you enjoyed today’s post, check out Why Living Longer Isn’t Always Living Healthier on Voronoi.
Tyler Durden
Fri, 05/01/2026 - 20:55
The post <a href=https://www.zerohedge.com/medical/hawaii-has-highest-life-expectancy-us-west-virginia-lowest target=_blank >Hawaii Has America's Highest Life Expectancy, West Virginia The Lowest</a> appeared first on Conservative Angle | Conservative Angle - Conservative News Clearing House
Continue reading...